Part 1: Where’s the Money?
Fuel gross margin or FGM is the money margin for fuel retailers. It is the common measure of fuel sales profitability. FGM minus net operating cost (NOC) equals a station’s net fuel profit margin. Given that most retail stations have an NOC of 10 ¢/g or more, FGM must exceed 10 ¢/g for a station to profit by selling gasoline or diesel fuel.
The equation for fuel gross margin is:
Fuel Gross Margin (FGM) = Retail price – Delivered Cost – Taxes
Delivered Cost = Rack price + Transportation
Rack price = Spot Price + Rack/Spot differential
Spot Price = Futures price + Spot/Futures differential
(The Spot/Futures differential is referred to as the Basis.)
Bringing all the components together:
FGM = Retail price – Futures – Basis – (Rack/Spot differential) – Transportation – Taxes
Fuel retailers control their retail price, though the retail price is affected by factors outside the retailer’s control (competitor prices, fuel sales volumes, convenience store sales and traffic). Fuel retailers have no control over the other components of FGM – futures, basis, rack/spot differential, transportation costs, and taxes. Retailers are at the mercy of the market for those other components. So, in effect, retailers have very little control over their FGMs and, therefore, little control over their net fuel profit margin.
Given the significant volatility in futures prices, some degree of volatility in basis, and little (but some) volatility in the rack/spot differential, transportation, and taxes, it is not surprising that data over the last five years show a wide range in FGMs. This wide range is exhibited in the following histograms (frequency distributions) based on U.S. average data and is representative of areas across the country.
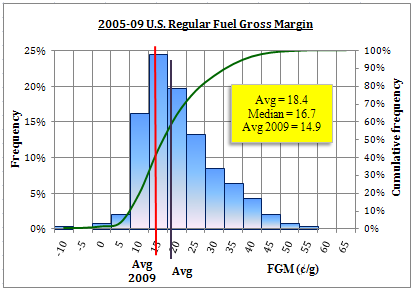
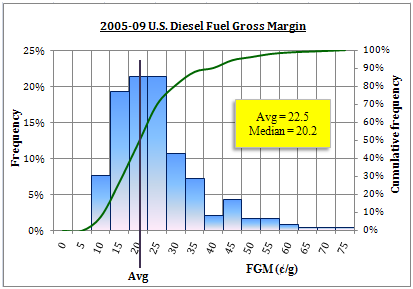
As indicated on the charts, the 5-year average FGM for regular gasoline is 18.4 ¢/g (median 16.7 ¢/g) and the 5-year average FGM for diesel fuel is 22.5 ¢/g (median 20.2 ¢/g). In 2009, the average FGM for regular gasoline decreased to 14.9 ¢/g.
California shows a similar pattern:
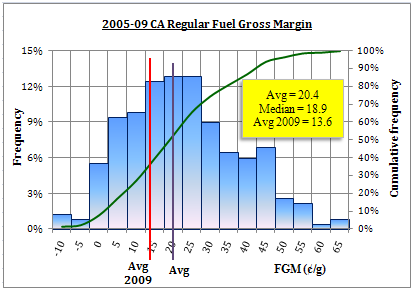
With NOCs of 10 ¢/g or higher, the net profit margin in 2009 on regular gasoline in the U.S. is less than 5 ¢/g, and less than 4 ¢/g in California.
Will average FGMs improve on their own? Not likely, given increased competition in retail fuel marketing from big-box retailers and grocery stores, whose primary objective is profitable store sales – not profitable fuel sales. Add a weak economy and political pressures to keep retail prices down and you have a recipe for FGMs averaging 12 to 17 ¢/g for the foreseeable future.
So what’s a fuel retailer to do? Most have decided to make the best of their C-store sales and hope for the best with FGMs. Will C-store sales make up for low margin fuel sales? For some, yes. For others … that’s a big gamble and, as the casinos in Las Vegas can attest, few gamblers win.
Well informed and creative fuel retailers will also make the best of their C-store sales, but they will go on offense to improve their fuel sales profitability. Going on offense entails understanding and utilizing currently available tools to manage futures prices and basis, and thereby actually set forward FGMs – not just hope the competition disappears or the market magically gets better.
Which type of retailer are you? Do you want to just hope the market takes care of your business, or do you want to take care of your business?
Next …
Part 2: Making Money


 Posted by TJL